Union City's condo median sale price reached $386,000 in June 2026, with single-family homes posting a median of $560,000. The condo market moved faster this month: days on market dropped to 33, down 31.3% year over year. Single-family DOM sits at 26 days, though that segment saw only 3 closings in June.
Union City figures are from the NJ REALTORS June 2026 Local Market Update. County-level appreciation figures are from the FHFA House Price Index. Chart data is from the Redfin Data Center, which reports all residential property types together.
Union City NJ Real Estate Market Overview: Q3 2026 Snapshot
Union City occupies a particular position on Hudson County's real estate map. Bordered by Weehawken, West New York, and North Bergen, the city offers Manhattan skyline proximity at price points that remain accessible relative to the waterfront markets immediately to the east.
The June 2026 data tells a story of correction and absorption. Condo median prices dropped 29.2% year over year to $386,000. Single-family median fell 37.8% to $560,000. But the pace of sales improved: condo DOM dropped from 48 days to 33 days, a 31.3% improvement. Properties that hit the market at current pricing move within five weeks.
Year-to-date figures show more stability. Condo median YTD sits at $365,000, down 19.3% from the same period last year. Single-family YTD median actually rose to $575,000, up 3.6% YoY. The monthly swings reflect thin transaction volume more than structural shifts.
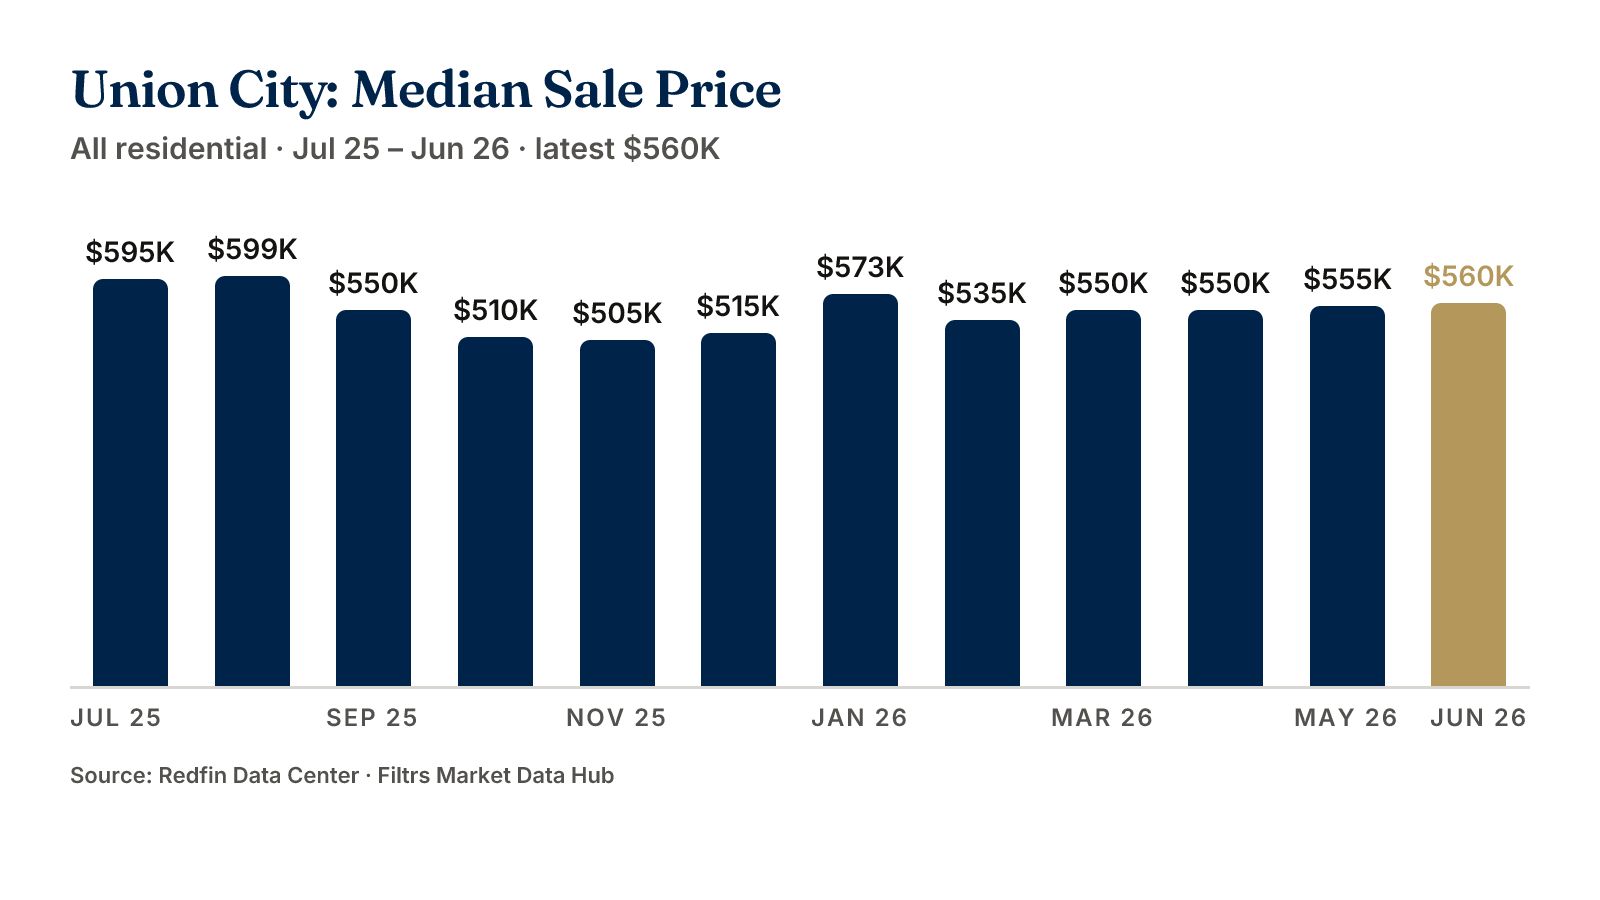
Union City median sale price — all residential, Jul 25 to Jun 26 (latest $560K). Source: Redfin Data Center.
Q3 2026 Market Data: Union City
| Metric | Condos/Townhouses | Single-Family |
|---|---|---|
| Median Sale Price (June 2026) | $386,000 | $560,000 |
| YoY Price Change | -29.2% | -37.8% |
| Days on Market | 33 | 26 |
| DOM YoY Change | -31.3% | +8.3% |
| Closed Sales (June) | 9 | 3 |
| YoY Closed Sales Change | -40% | +200% |
| Active Inventory | 96 | 2 |
| Inventory YoY Change | +18.5% | 0% |
| Months of Supply | 7.0 | 0.8 |
| Pct of List Received | 100.4% | 104.6% |
| YoY Pct List Change | +0.6% | +4.6% |
Single-family inventory sits at just 2 homes, creating a 0.8-month supply. That segment operates as a seller's market with buyers competing for scarce listings. Condos show 7 months of supply from 96 active listings, tilting toward buyer-favorable conditions.
For Hudson County context: the FHFA House Price Index shows 47.5% appreciation over five years and 106.8% over ten years at the county level. Union City participates in this broader trend, though specific appreciation rates vary by property type and location within the city.
Year-to-Date Performance
| Metric | Condos/Townhouses | Single-Family |
|---|---|---|
| YTD Median Sale Price | $365,000 | $575,000 |
| YTD YoY Price Change | -19.3% | +3.6% |
| YTD Days on Market | 49 | 34 |
| YTD DOM Change | +14% | +47.8% |
| YTD Closed Sales | 65 | 13 |
| YTD Sales YoY Change | -18.8% | +225% |
| YTD New Listings | 193 | 20 |
| YTD Pct of List Received | 99.3% | 100.7% |
The YTD picture differs from monthly snapshots. Condo sales volume dropped 18.8% with 65 closings through June. Single-family volume surged 225% on 13 closings, though that percentage reflects a low base (4 sales in H1 2025). New condo listings dropped 6.3% to 193 units. Single-family listings jumped 42.9% to 20 homes.
Union City Condos: Market Dynamics
Union City's condo market spans a wide range. The $386,000 median reflects the city's mix of older walk-ups and newer construction. Entry points exist below the median in older buildings. Newer construction along the eastern ridge trades at premiums above the median.
The 100.4% list-to-sale ratio tells an important story. Properly priced condos sell at or slightly above asking. The +0.6% YoY improvement suggests sellers who price at market achieve their targets. Overpriced listings contribute to the elevated 7-month supply figure.
Condo inventory of 96 active listings represents an 18.5% increase from last year. More choices for buyers. More competition among sellers. The 33-day DOM shows well-priced units move within five weeks. Properties sitting past 45 days signal overpricing.
New listings dropped 26.5% in June to 36 units. Fewer sellers entering the market while inventory remains elevated. Absorption continues despite the correction in median prices.
For buyers evaluating Union City against neighboring markets, our Weehawken NJ Real Estate: 2026 Neighborhood Guide details waterfront market dynamics at different price points.
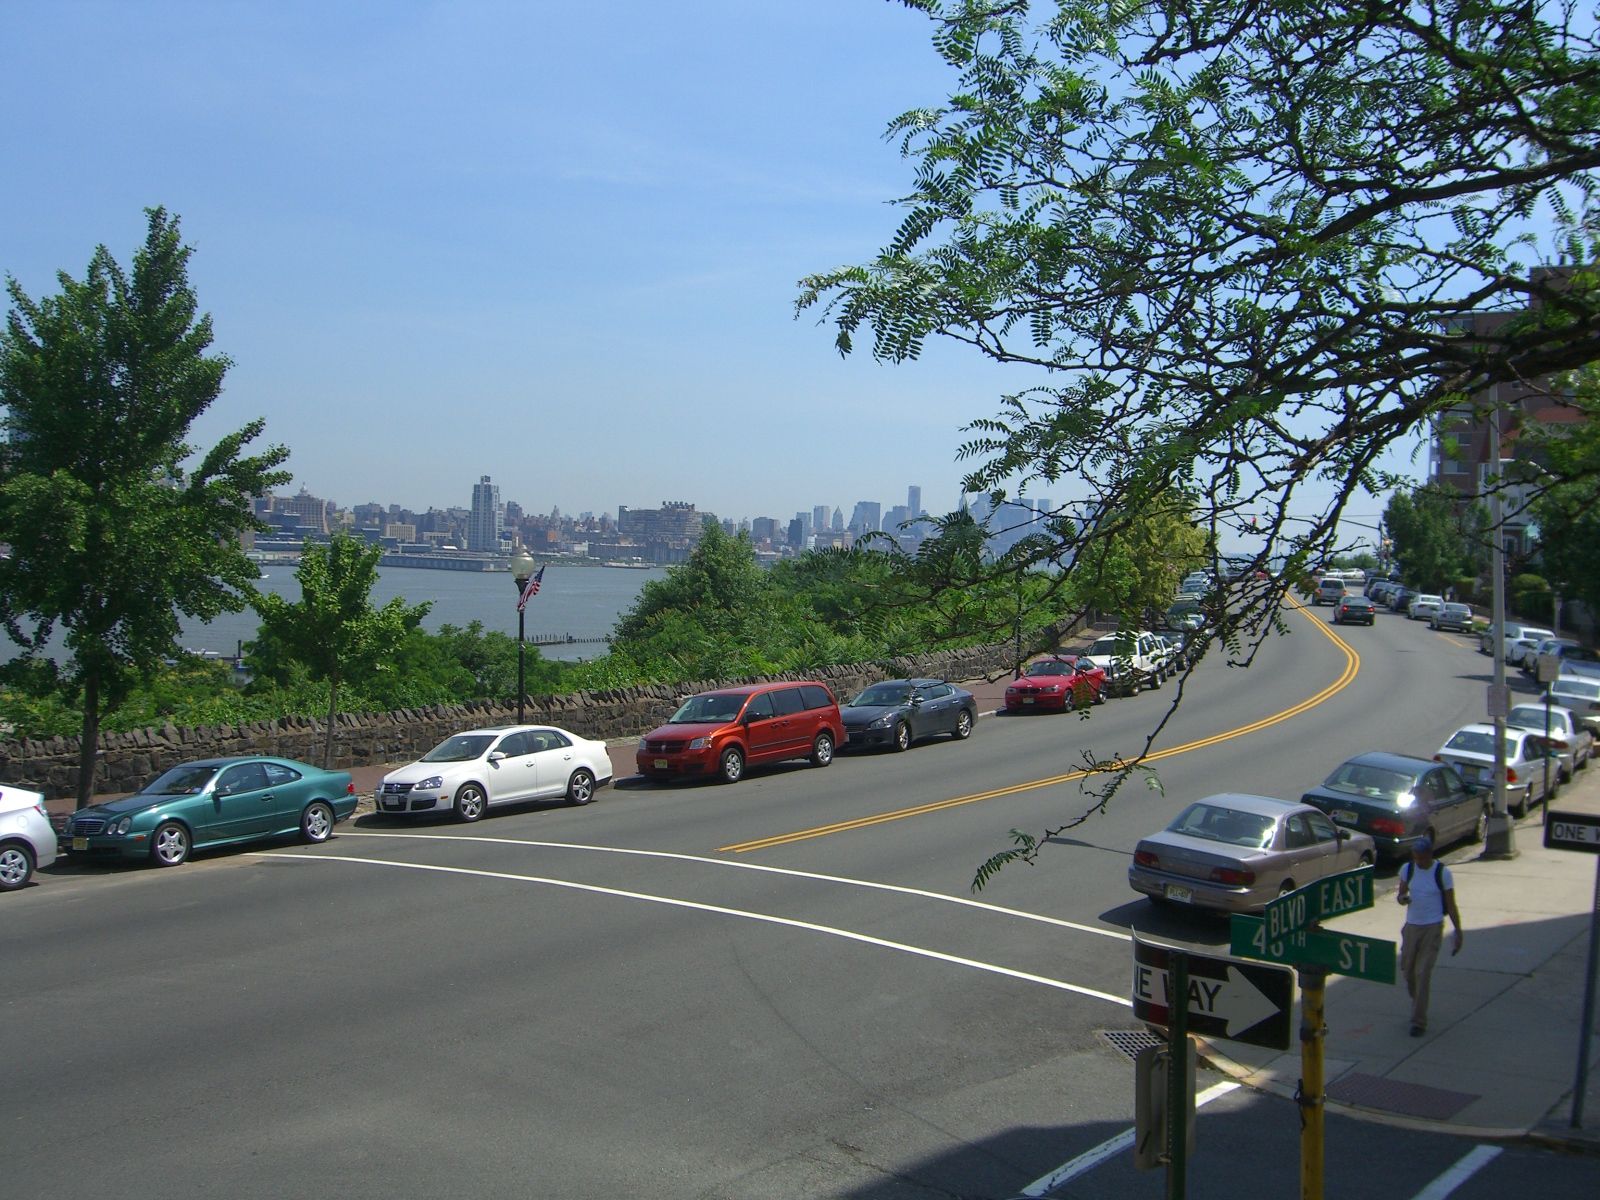 Photo: Luigi Novi / Wikimedia Commons, CC BY 3.0
Single-Family Segment Analysis
Single-family homes in Union City operate in a different market entirely. Two active listings create a 0.8-month supply. That is an acute seller's market by any measure.
The $560,000 June median dropped 37.8% year over year, but context matters. Three closings in June versus one closing in June 2025. Small sample sizes create volatile medians. The YTD median of $575,000 (up 3.6%) provides a steadier read.
Single-family buyers paid 104.6% of asking price in June, up 4.6% from last year. Competition for scarce inventory drives above-asking offers. The 26-day DOM reflects quick absorption.
Transaction volume tells a growth story. Thirteen single-family closings YTD versus 4 last year represents 225% growth. New listings rose 42.9% to 20 homes through June. More single-family activity overall, though the segment remains thin relative to condos.
Neighborhood Spotlight: Where Buyers Are Looking
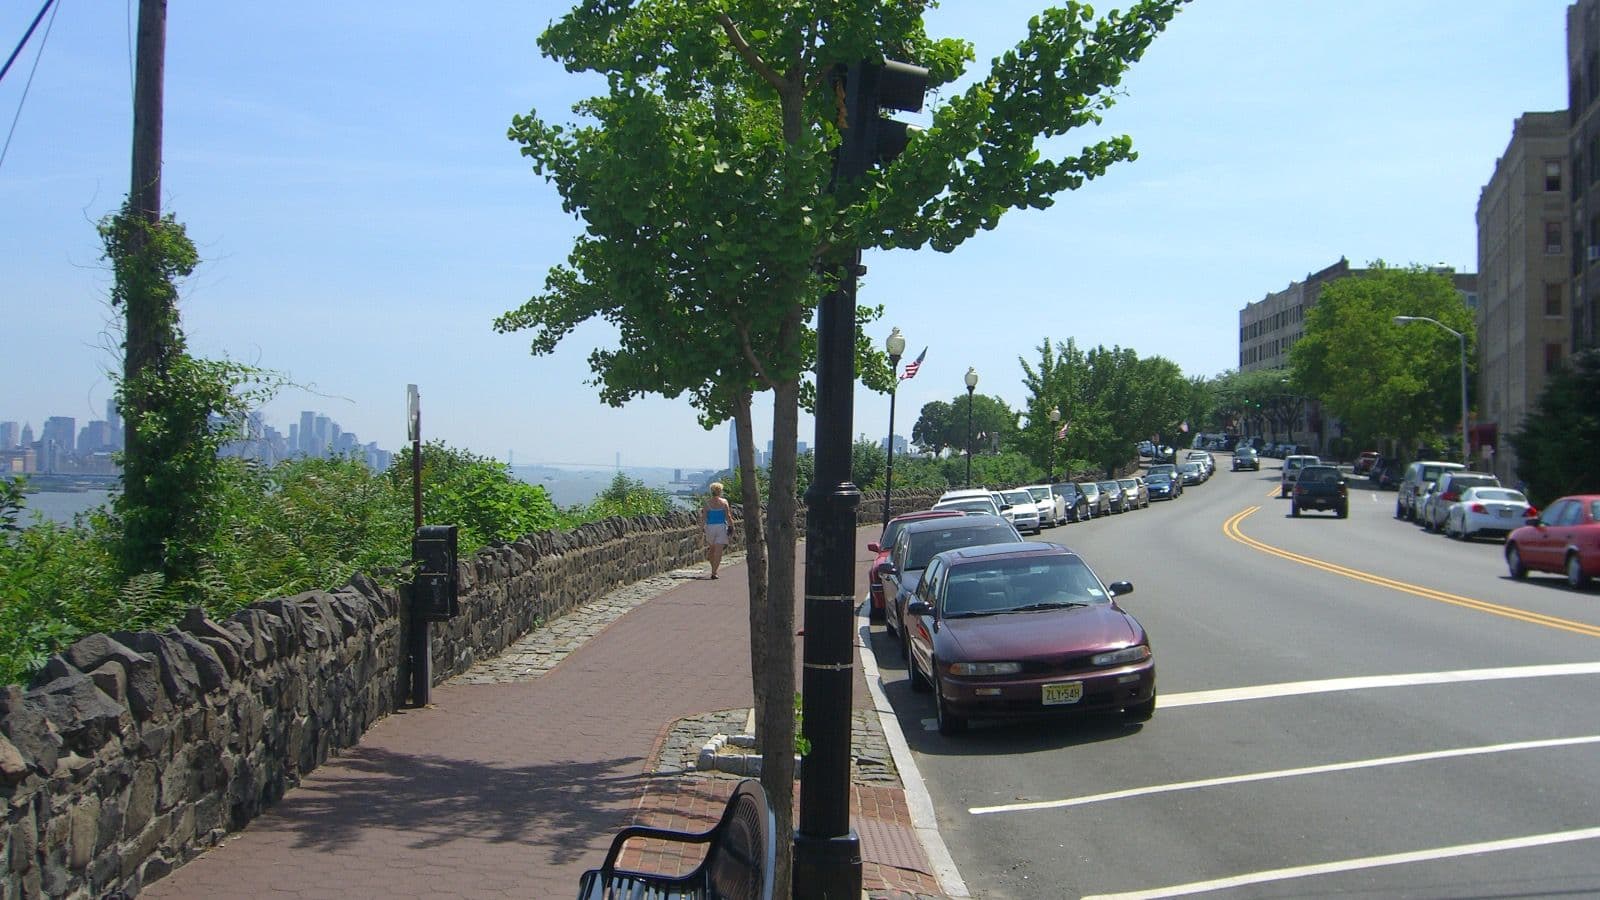
Union City's geography creates distinct micro-markets. The eastern ridge along Palisade Avenue and Mountain Road captures Manhattan skyline views. Properties here trade at premiums. These blocks offer direct sightlines to Midtown and proximity to Weehawken's waterfront amenities.
The Meadowview section in the central-western portion offers lower price points per square foot. Walk-ups and smaller multi-family properties characterize the housing mix. Proximity to Bergenline Avenue means walkable access to Latin American eateries, shops, and services.
New Durham in the northern reaches borders North Bergen and offers slightly larger lots for single-family homes. The area features more detached housing and yard space relative to the denser blocks closer to the waterfront.
Bergenline Avenue functions as Union City's commercial spine. The corridor runs north-south through the city, lined with restaurants, bakeries, bodegas, and retail. It defines Union City's character as much as any housing statistic. The Cuban Day Parade draws crowds each June. Local establishments serve authentic Cuban, Dominican, and Colombian cuisine.
Transit access varies by block. Blocks along the eastern ridge sit closest to the Weehawken ferry terminals. NJ Transit bus routes serve the entire municipality.
What This Means for Sellers
The 100.4% list-to-sale ratio for condos shows properly priced properties achieve asking price. Single-family sellers receive 104.6% of asking price when buyers compete for limited inventory.
But 7 months of condo supply changes the equation. Buyers have 96 active listings to choose from. Price matters more than any other factor. The 33-day DOM rewards sharp pricing. Properties sitting 45+ days need reductions to re-engage buyers.
For single-family sellers, the math favors listing now. Two active listings means virtually no competition. The 0.8-month supply creates urgency among buyers. Expect multiple offers on properly presented homes.
Price at market from day one. The YTD data shows DOM rising (condo DOM up 14%, single-family up 47.8%). Longer marketing periods trend upward. First-mover advantage matters. Homes that hit right from the start outperform those that chase the market down.
For sellers curious about current value, a New Jersey home valuation provides data-driven pricing guidance before listing.
What This Means for Buyers
Condo buyers hold leverage. Seven months of supply creates negotiating room. The 29.2% median price drop reflects real correction. Ninety-six active listings provide options across price points and building types.
Target properties sitting past 45 days. Those sellers face pressure to negotiate. The YTD list-to-sale ratio of 99.3% shows deals close below asking when buyers have patience.
Single-family buyers face tighter conditions. Two listings and 0.8 months of supply means competition. The 104.6% list-to-sale ratio shows buyers pay above asking. Pre-approval matters. Clean offers win.
Current mortgage rates around 6.69% (Freddie Mac, week of August 6, 2026) affect purchasing power across all price points. Run the monthly payment math before falling in love with a property.
Property taxes are based on assessed value, which typically runs lower than transaction prices. Specific tax calculations depend on the municipality's assessment ratio and the county equalization rate. Budget for property taxes based on the city's current rate applied to the assessed value, not the purchase price.
Comparison: Union City vs. Regional Context
| Metric | Union City Condos | Union City Single-Family | Hudson County (Context) |
|---|---|---|---|
| Median Sale Price | $386,000 | $560,000 | Varies by municipality |
| YoY Price Change | -29.2% | -37.8% | +9.6% (FHFA HPI) |
| Days on Market | 33 | 26 | Varies |
| Months of Supply | 7.0 | 0.8 | Varies |
| Pct of List Received | 100.4% | 104.6% | Varies |
Hudson County's FHFA House Price Index rose 9.6% year over year. The county's five-year appreciation reached 47.5% and ten-year appreciation hit 106.8%. Union City's monthly median corrections run counter to this trend, though YTD single-family prices rose 3.6%, suggesting the correction may be stabilizing.
The $386,000 condo median positions Union City below many Hudson County waterfront markets. Buyers prioritizing value over waterfront access find entry points here with comparable transit times to Manhattan.
Q3 2026 Market Forecast
The data supports cautious optimism through Q3 2026. Condo DOM dropping 31.3% signals improving absorption. Single-family activity surged on volume (225% YTD) even as prices corrected. The market clears inventory when priced correctly.
Watch the 7-month condo supply figure. If absorption continues at current pace (9 closings in June), supply should stabilize or decline through Q3. Declining supply with steady demand sets up for price stabilization.
Single-family scarcity (2 active listings) creates seller-favorable conditions in that segment for the foreseeable future. New listings rose 42.9% YTD, but demand absorbed those additions.
Buyers should expect competition for well-priced properties in both segments. Pre-approval establishes credibility with sellers. Financing contingencies remain standard, but larger down payments strengthen competitive position.
FAQ
What is the median home price in Union City NJ in Q3 2026?
Union City's June 2026 condo median hit $386,000, down 29.2% year over year. Single-family median reached $560,000, down 37.8% YoY. Year-to-date figures show more stability: condo median at $365,000 (down 19.3%) and single-family at $575,000 (up 3.6%).
Is Union City NJ a buyer's or seller's market right now?
It depends on property type. Condos show 7 months of supply from 96 active listings, creating buyer-favorable conditions. Single-family has just 2 active listings and 0.8 months of supply, a clear seller's market. Condo buyers have negotiating room; single-family buyers face competition.
How long do homes typically stay on the market in Union City?
Condos averaged 33 days on market in June 2026, down 31.3% from 48 days last year. Single-family homes averaged 26 days. Properties priced at market move within five weeks. Listings past 45 days typically require price adjustments.
Are Union City condos a good value for first-time buyers?
The $386,000 condo median positions Union City below many Hudson County waterfront markets. Transit access to Midtown Manhattan takes 20 to 30 minutes depending on route. Seven months of supply and 96 active listings give buyers choices and negotiating room.
What percentage of asking price are sellers receiving in Union City?
Condo sellers received 100.4% of asking price in June 2026, up 0.6% year over year. Single-family sellers received 104.6%, up 4.6% YoY. Properly priced properties achieve or exceed asking price; the elevated supply in condos rewards competitive pricing.
Why did Union City home prices drop in 2026?
Monthly median prices reflect thin transaction volume. June saw 9 condo closings and 3 single-family closings. Small sample sizes create volatile medians. Year-to-date data shows more moderate corrections: condo median down 19.3%, single-family median actually up 3.6%.
How does Union City compare to neighboring Hudson County towns?
Union City's $386,000 condo median offers a lower entry point than waterfront markets in Weehawken, Hoboken, and Jersey City. Transit times converge despite the price gap. The Weehawken ferry to Midtown sits minutes away. Light rail connects to Hoboken Terminal for PATH access.
What should sellers know about listing in Union City right now?
Price at market from day one. Condo inventory of 96 listings means buyers have options. The 33-day DOM rewards sharp pricing. Single-family sellers face better conditions: 2 active listings and 104.6% of asking price. Consider a pre-listing inspection to address buyer objections upfront.
Hero photo: Luigi Novi / Wikimedia Commons, CC BY 3.0
If these numbers raise questions about a specific property or block, a New Jersey home valuation can clarify where your property sits relative to current market conditions.